
Norfolk's unemployment rate was 4.2% in September, up from 3.9% a year earlier, as the U.S. rate fell to 4%. About 1,800 fewer residents had jobs.
Norfolk’s unemployment rate was 4.2% in September, up from 3.9% in September 2025. About 230 more residents were out of work than a year earlier.
The national rate moved the other way. It fell to 4% from 4.3%.
The figures are the preliminary September estimates from the U.S. Bureau of Labor Statistics’ Local Area Unemployment Statistics program. They are not seasonally adjusted, so the fair comparison is with the same month a year earlier. Norfolk’s rate was unchanged from August.
Norfolk against its neighbors
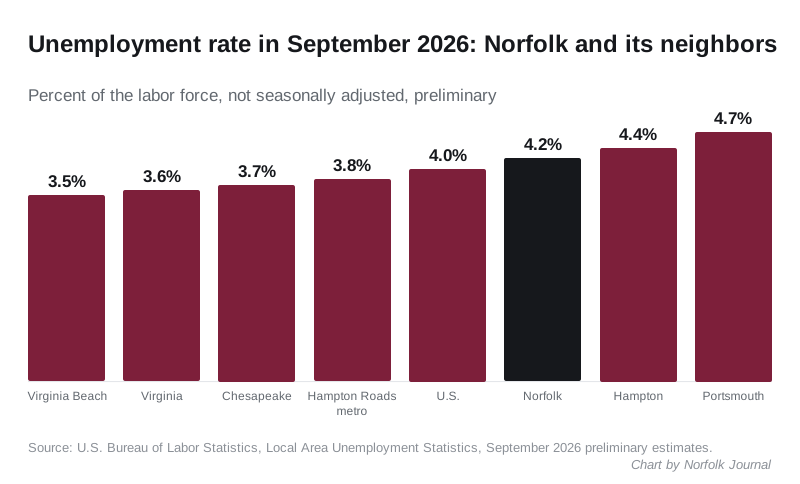
| Area | September 2026 | September 2025 |
|---|---|---|
| Virginia Beach | 3.5% | 3.1% |
| Virginia | 3.6% | 3.4% |
| Chesapeake | 3.7% | 3.3% |
| Hampton Roads metro area | 3.8% | 3.5% |
| United States | 4% | 4.3% |
| Norfolk | 4.2% | 3.9% |
| Hampton | 4.4% | 4.2% |
| Portsmouth | 4.7% | 4.4% |
All rates are not seasonally adjusted. Sources: BLS series for Virginia Beach, Virginia, Chesapeake, the Hampton Roads metro area, the United States, Hampton and Portsmouth.
Norfolk’s rate was above the state, metro and national rates. Portsmouth, about eight miles southwest across the Elizabeth River, was highest in the group at 4.7%. Hampton, about nine miles north, was 4.4%. Neighboring Virginia Beach was lowest at 3.5%.
Every Hampton Roads city in the table rose over the year. Virginia Beach and Chesapeake rose 0.4 points, the most in the group. Norfolk and Portsmouth rose 0.3 points and Hampton 0.2.
The numbers behind the rate
In Norfolk in September, according to the BLS:
- 105,653 people were in the labor force, down from 107,214 a year earlier.
- 101,196 people had jobs, down from 102,990.
- 4,457 people were unemployed, up from 4,224.
So the rate rose for two reasons. About 1,800 fewer residents had a job, and the labor force shrank by about 1,560.
The labor force counts people who have a job or are looking for one. The unemployment rate is the share of the labor force without a job and looking for one. These are counts of Norfolk residents, wherever they work. They are not counts of the jobs based in the city, so a sailor or shipyard worker who lives in Chesapeake is not in Norfolk’s figures.
The BLS figures do not say why fewer residents had jobs. Retirements, people moving away and people who stop looking for work all shrink the count.
The past year, month by month
Norfolk’s rate moved between 3.9% and 4.7% over the year. It was lowest in September 2025 and highest in January.
| Month | Norfolk | Virginia |
|---|---|---|
| September 2025 | 3.9% | 3.4% |
| October 2025 | no data | no data |
| November 2025 | 4.5% | 3.9% |
| December 2025 | 4% | 3.5% |
| January 2026 | 4.7% | 3.9% |
| February 2026 | 4.6% | 3.9% |
| March 2026 | 4.4% | 3.8% |
| April 2026 | 4% | 3.4% |
| May 2026 | 4.1% | 3.6% |
| June 2026 | 4.4% | 3.9% |
| July 2026 | 4.5% | 3.7% |
| August 2026 | 4.2% | 3.6% |
| September 2026 | 4.2% | 3.6% |
The BLS published no local figures for October 2025 because of the 2025 lapse in federal appropriations, the agency notes on each series.
What it means for you
- If you are looking for work, the state’s job listings and career centers are on Virginia Works. The City of Norfolk posts its own openings on its careers page.
- If you run a business, a smaller labor force can mean fewer applicants.
- These are preliminary figures. The BLS revises each month’s estimates a month later. We will update this story when the October figures come out.
Related: Norfolk, Portsmouth, Hampton and Poquoson compared and moving to Norfolk.
Have your say